SecureBytes NOC Stack
Internal observability stack — Grafana dashboards over Prometheus with Node Exporter on every host. Sixty-second scrape interval, push notifications via ntfy.

What it covers
Node Exporter on everything, no exceptions
Cost is ~10MB of RAM per host. The value is that nothing is invisible when something behaves weirdly. Curating what's worth monitoring up-front is premature optimization for a homelab.
60-second scrape interval
Faster intervals sound better but quintuple storage cost without changing how the data is actually used. 60s is fine for everything except acute incidents, and during those you're on the host with top.
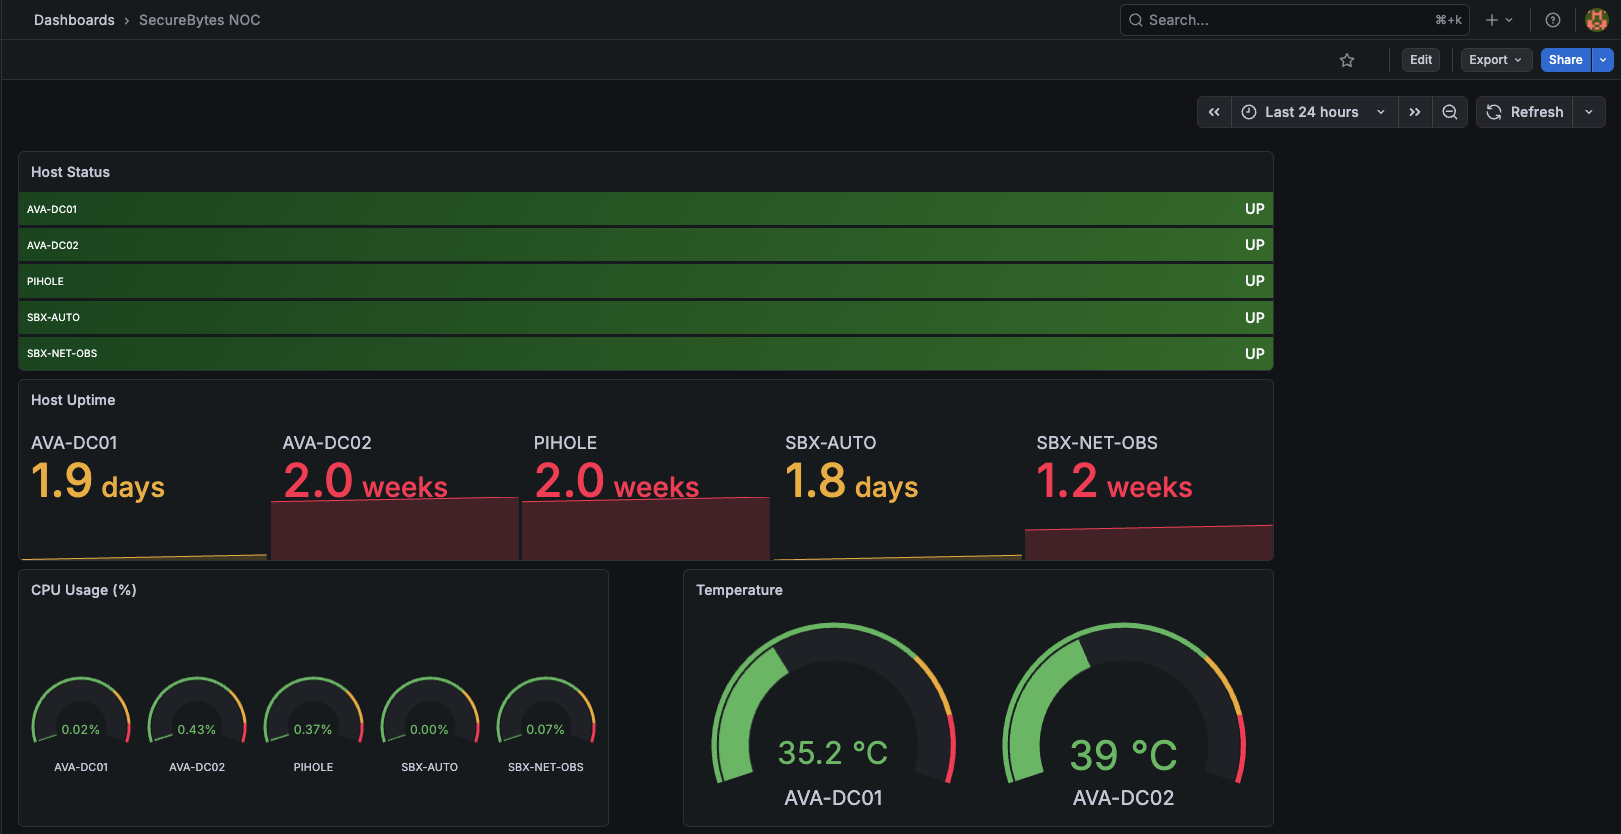
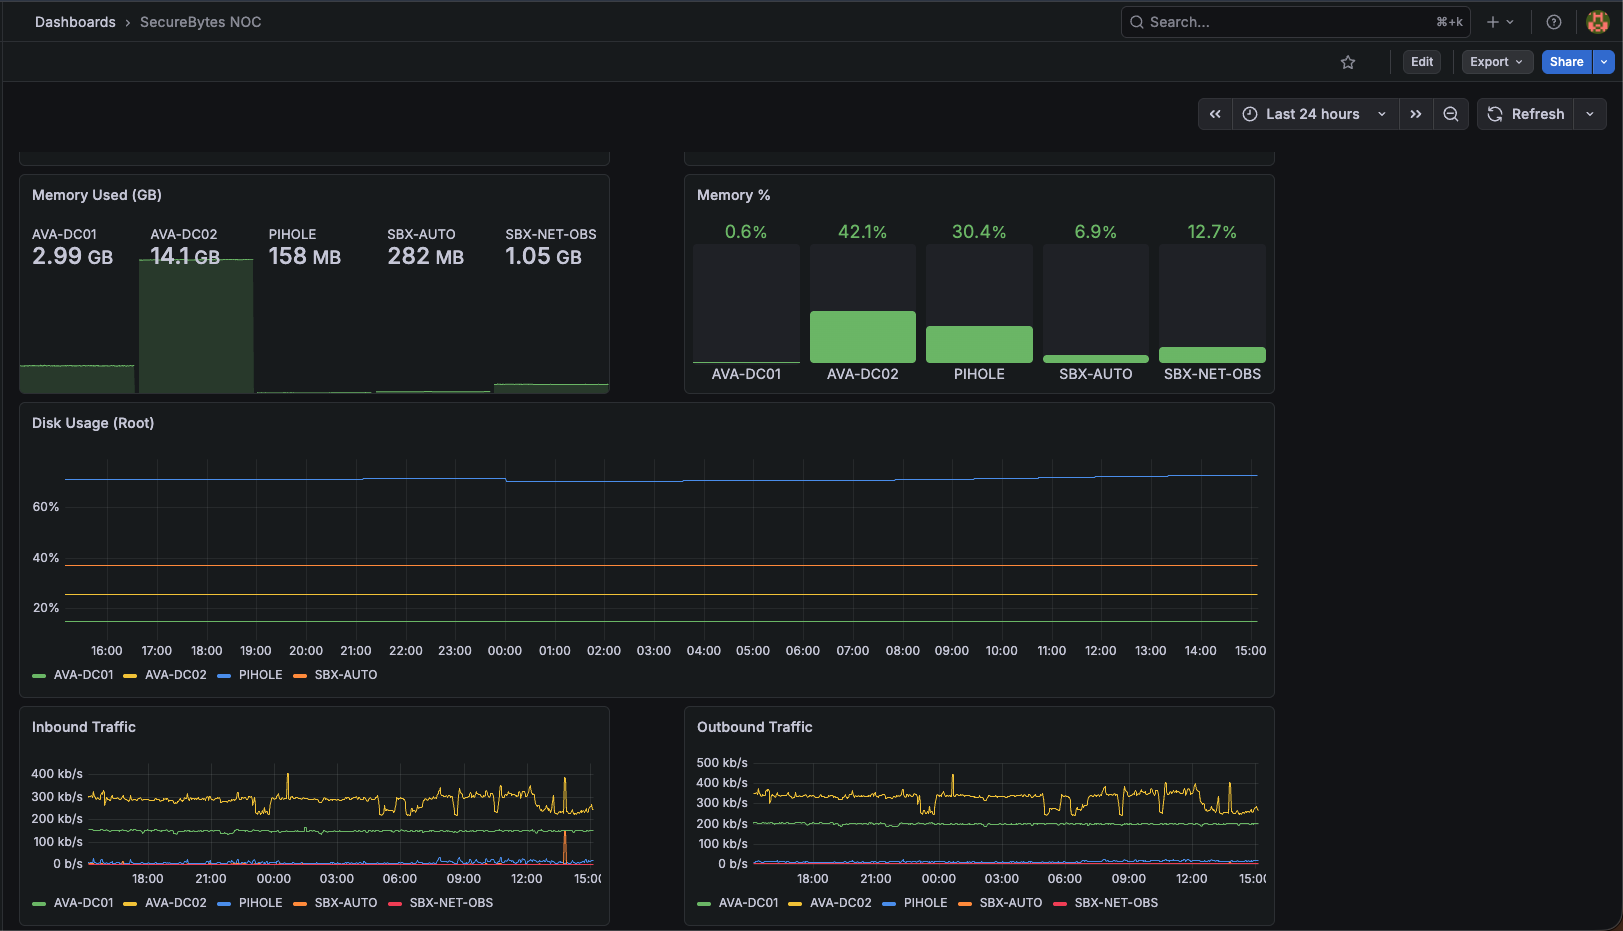
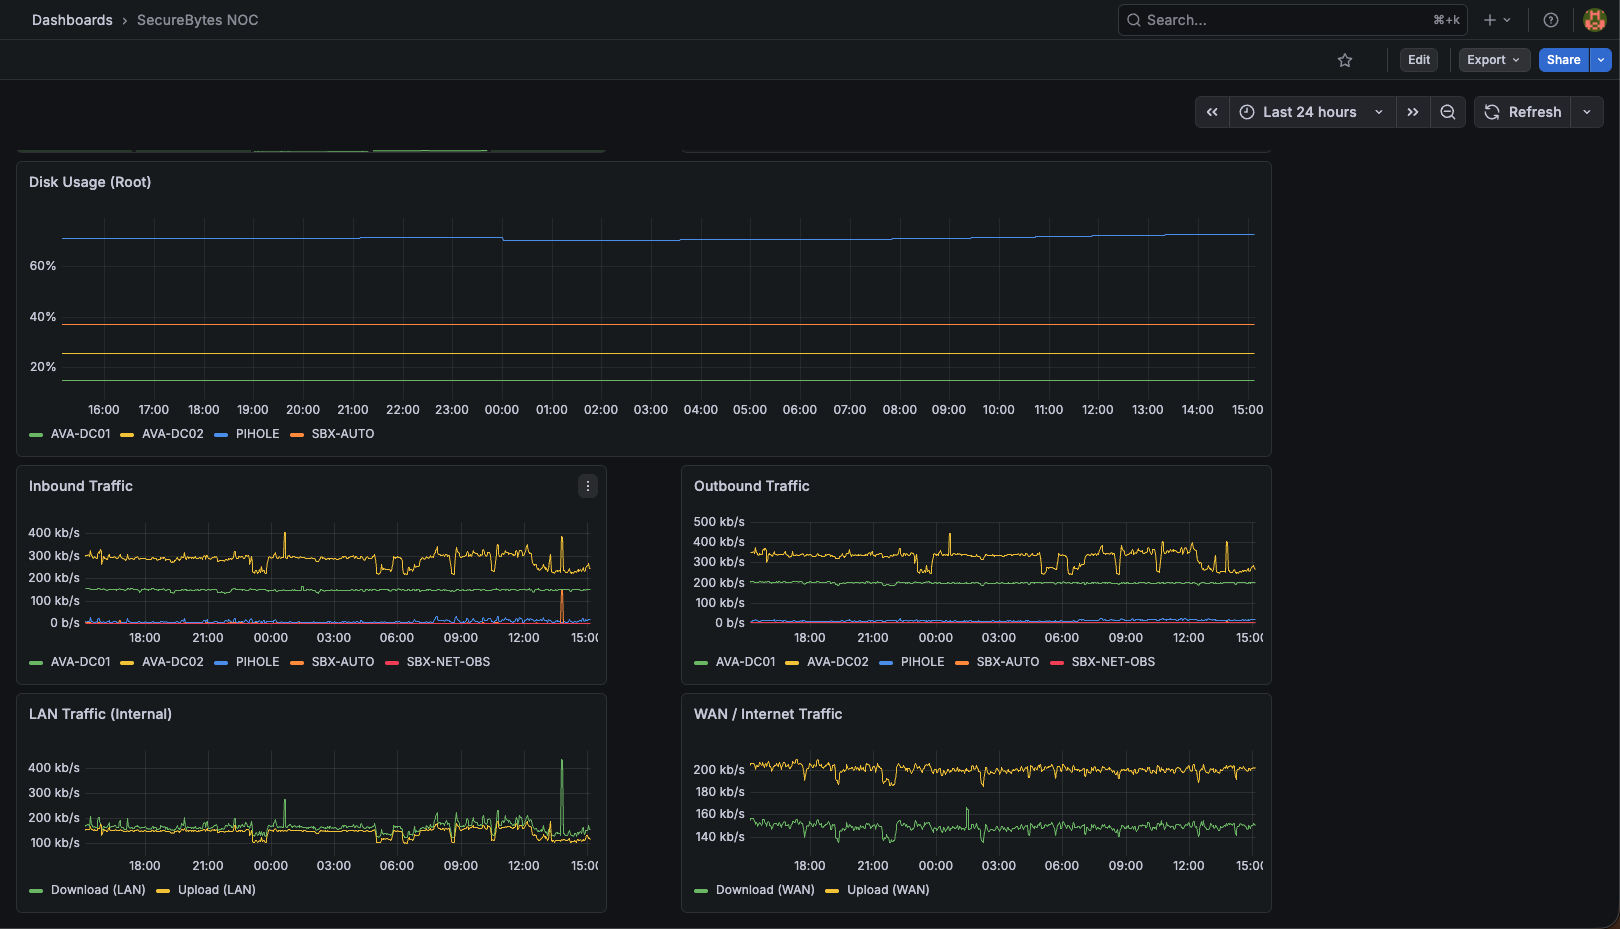
One consolidated dashboard
Separating by category broke the muscle memory — every glance became a navigation problem. One dashboard, scroll to find what you need. Boring, but it works.
Roadmap
Stack